Accelerating the grading of assessments by understanding information hierarchy (Grade by Question)

The Problem
-
The current grading process for an assessment is very time consuming and tedious
-
A lot of context switching is required to go from a table with student names to a specific student submission
-
Teachers hesitate to administer assessments using Schoology because of how time-consuming the grading experience is. Instead, they frequently use other platforms and assessment tools.

Old grading experience
My Role
I assisted in the User Experience (UX), led the UI design effort and implementation. Worked collaboratively with the product manager, lead product designer, and development team to ensure quality and consistency were met.
Main Responsibilities
-
Research assistant
-
Interaction design details
-
Visual design exploration (UI)
-
Implementation
Research
What we wanted to learn?
-
Teachers complain about the grading process being slow and tedious. What are the specific interactions that make the process slow?
-
What are the most important pieces of information users need to be able to grade assessments?
Methodologies
-
Remote discovery interviews
-
Optimal Workshop survey
-
Unmoderated concept testing and open questions
-
Remote moderated usability testing
What we learned during research?
-
When teachers grade assessments, it is more common for them to grade one question at a time rather than looking at a complete assessment per student.
-
Teachers want to be able to compare the quality of the responses as a whole rather than looking at who is submitting each response in order to evaluate student performance more consistently.
-
It is hard to be objective about the students (after all, teachers are human).
-
Teachers need help identifying the areas where students need more support.
Hypotheses
-
By summarizing the questions, average scores, and the grading status together on one page, the instructor would be able to prioritize the questions that need attention. We will know that the hypothesis is correct if the time required to grade an assessment decreases.
-
By allowing the instructor to grade by question, they obtain a better understanding of how the class performed on the assessment. Potential bias towards some students would also decrease.
Concepts & Testing
We spent a significant amount of time iterating and testing the main user flow and some of the secondary flows that had high complexity in terms of interactions. We started by getting the main user flow ready (user goes from summary to single question with the ability to see all students on the same screen) and then moved to secondary flows, from highest complexity to lowest.

Early concept wireframes
Usability Testing
-
Remote moderated usability studies (2 rounds of feedback and 8+ sessions).
-
Unmoderated concept testing and open questions via Optimal Workshop (5 rounds of feedback and 500+ responses).

Moderated usability testing sessions

Unmoderated usability testing - heat map and task analysis
First Release
-
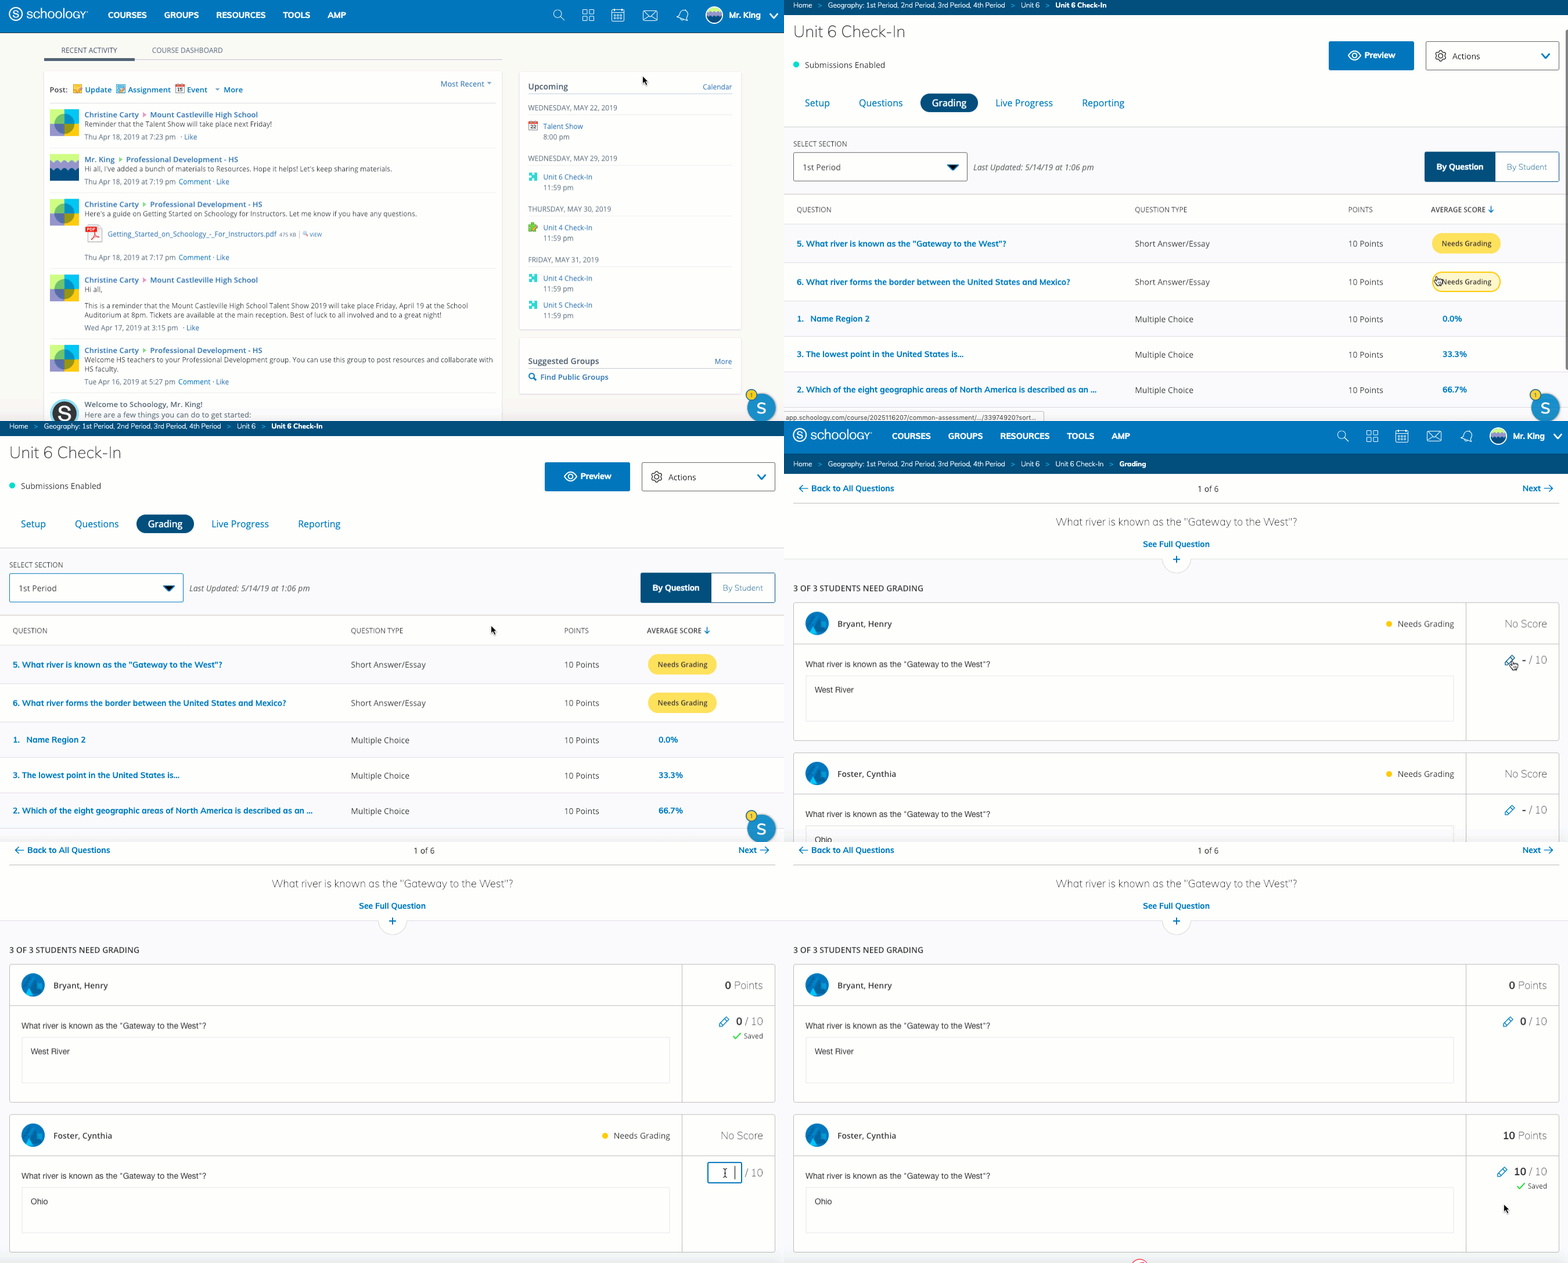
Adding a view of assessment submissions where teachers can choose to grade responses by question, in addition to grading by student.
-
Grade by question with the ability to see all the submissions in addition to the number of attempts by student.
-
Grading status (needs grading/graded).
-
Average score for each question.
-
Teachers can review the original question in the assessment, the grading instructions and the grading rubric.
Design Deliverables
Design worked closely with the development team during the implementation process. Below are some examples of the specs and breakpoints that were provided to the development team.

Design specs for development

Responsive breakpoints
Launched Version
%20%5E.png)

%20%5E.png)
The Impact
Over the months following the launch of this new feature we have been targeting roles through Pendo who use the grade by question feature and asked them about their satisfaction with the new workflow. The responses were overwhelmingly positive!
We asked two questions based on a 5 point scale with 5 being the most satisfied. The two questions were on usability and satisfaction level and of the 5,000 instructors using this feature we had responses from about 30%. Of that, both questions asked averaged above a 4 out of 5.